
As previously mentioned, I’m enrolled in the University of Nicosia free MOOC on digital currencies. One of the assignments for each lecture in the course is to write a brief essay for each of a couple topics related to the material covered in that lecture. To encourage myself to put more effort in my responses and gather feedback from readers not necessarily enrolled in the course with me, I’ve decided to publish each of my responses as a separate post on this site. I’d love your feedback, whether you like what I wrote or not. Without further ado, here’s the first of my responses.
The prompt is: post a short paragraph, describing your local currency and how potential changes in its supply or demand you are aware of, have affected its exchange rate over a timeline you choose.
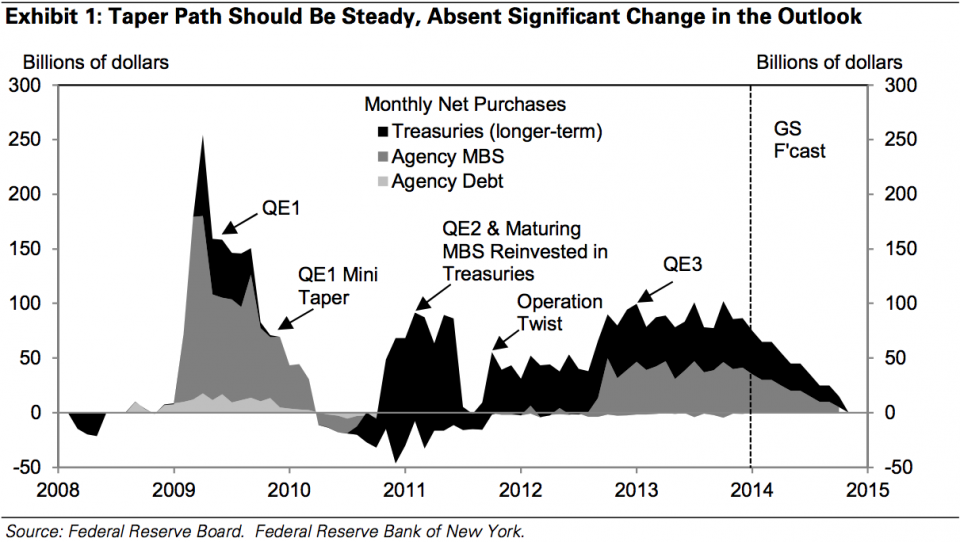
My local currency is the United States Dollar, a sovereign form of fiat money, centrally issued by the U.S. Federal Reserve and used more often in international transactions than any other currency. In late 2008, the Fed began a monetary policy called quantitative easing, injecting dozens of billions of additional dollars into the circulating money supply each month. This chart shows the total value of dollars put into circulation through quantitative easing from 2008 through the present, with a projection of future activity through 2015:
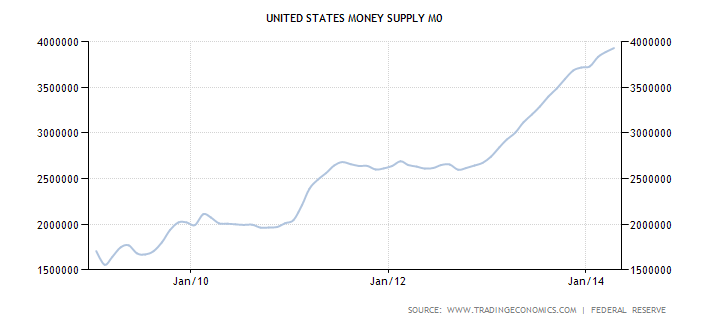
The next chart shows, after accounting for the effects of quantitative easing, the total base money supply (M0) of U.S. Dollars in circulation from January 2009 through the present (in millions of dollars):
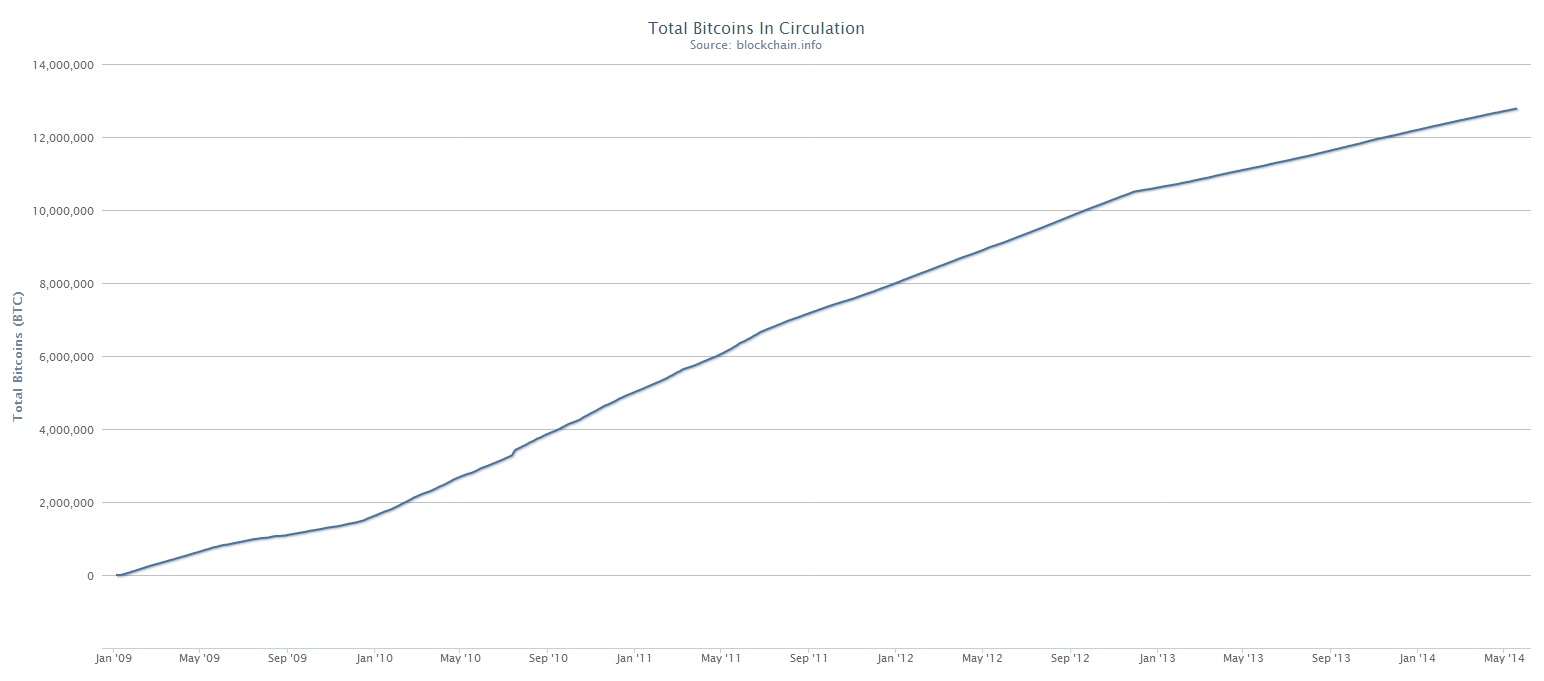
The currency I have chosen to compare against the Dollar is Bitcoin. First mined in early January 2009, Bitcoin is a private, decentralized, digital cryptocurrency which, unlike the U.S. Dollar, has a fixed total supply (21 million Bitcoins to be mined by circa 2140), which is fabricated according to an open source Bitcoin generation algorithm. Accordingly, the total money supply of Bitcoins in circulation has smoothly increased from zero on January 1, 2009 to approximately 13 million today:
If we compare the quantity of Dollars and Bitcoins in circulation across the selected time horizon, we see that the supply of Dollars in January 2009 was approximately 1.70 x 10¹⁶ whereas the supply of Bitcoin was near 1. Presently the supply of Dollars has climbed to nearly 3.93 x 10¹⁶ and Bitcoin has risen to 1.28 x 10⁷. Over the past four years, the supply of Bitcoin has increased exponentially; whereas, Dollars have merely doubled. Therefore, all else being equal, we should expect the price of Bitcoin relative to Dollars to have plummeted in the past four years. Of course that expectation is not reflected in reality:
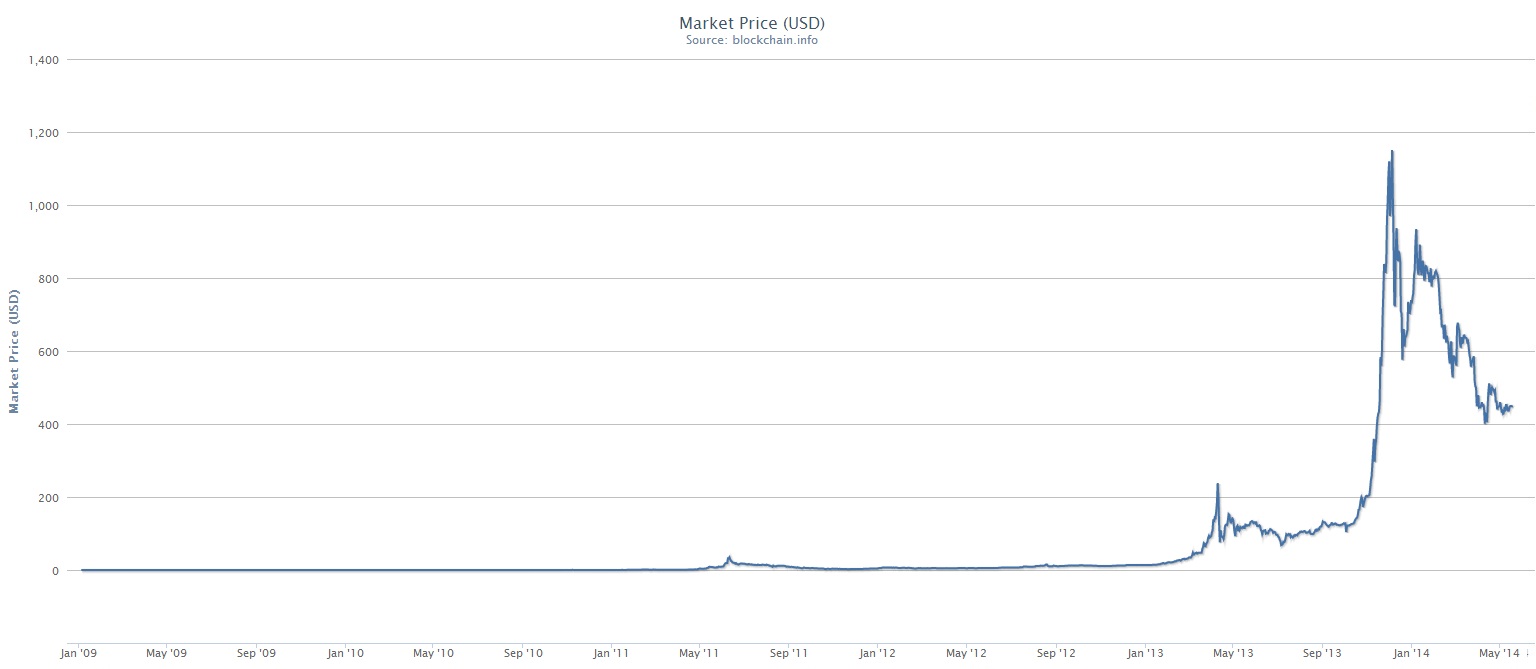
The preceding graph shows the price of Bitcoin in Dollars over the past five years. From the data, the price looks fairly stable until a first, small blip and downswing around May 2011, a larger jump and softening of price May 2013, and a last dramatic spike cycle this past December. So given what we know about the supply of these two currencies, why is a Bitcoin now trading near $450 dollars when January 2009 it was worth mere pennies?
As a new currency Bitcoin has certainly been very volatile since its inception, a quality that will hopefully subside as Bitcoin grows older. However, volatility could account for erratic price movement but would not explain the upward trend, especially given the disparity in rates of inflation of Bitcoin relative to Dollars. I believe that the upward price trend is best explained by changes in relative demand, as well as current expectations of future demand.
In the past five years, the number of individuals and businesses willing to accept Bitcoin as tender has grown considerably. Furthermore, the expectation about the future of Bitcoin has grown immeasurably more positive since 2009. Therefore, I believe, relative to the U.S. Dollar, the burgeoning demand for Bitcoin since 2009 has offset the rising supply and this growing demand accounts for the increasing price of Bitcoin.
Sources:
1) A Complete History Of Quantitative Easing In One Chart
http://www.businessinsider.com/quantitative-easing-chart-2014-1
2) United States Money Supply M0 [2009 – 2014]
http://www.tradingeconomics.com/united-states/money-supply-m0
3) DFIN-511 Introduction to Digital Currencies, Session 1: A brief history of money
4) Total Bitcoins in Circulation [All Time]
5) Market Price (USD) [All Time]
